Thread dumps are one of the very important JVM reports , which we can use to analyse server/JVM hang situations and the root cause of it.
Pre - requisites for this experiment:
- WebLogic installed
- Domain Configuration
- AdminServer,Managed Servers Running state
There are 2 ways to Generate Thread Dumps in WebLogic:
1) From WebLogic Admin Console
2) Using WLST commands
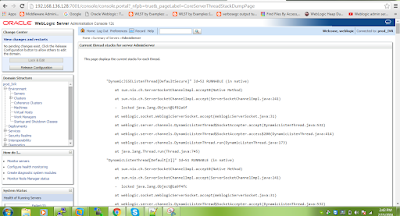
1) ThreadDump from WebLogic Admin Console:
- Open Servers tab in Admin Console
- Select Admin/Managed Servers
- Select Monitoring -> Threads tab
- Then click on Thread Dump ->Dump Thread Stacks
 |
| Generating Thread Dumps using Admin Console |
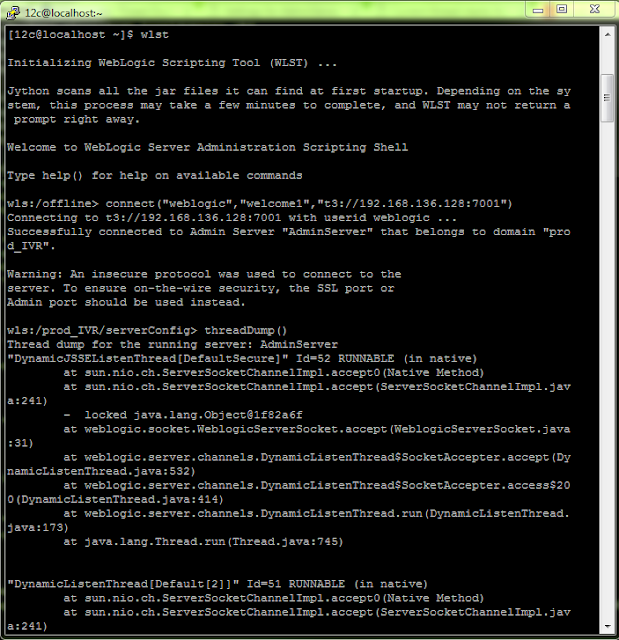
2) Using WLST commands:
- Set the CLASS PATH by using Environment variables("java weblogic.WLST") to connect WLST
- Then it will connect to wls:/offline>
- connect("username","password","url:port")
- Example: connect("weblogic","welcome1","192.168.136.128:7001")
- threadDump()
WLST:
 |
Thread Dump using WLST
|
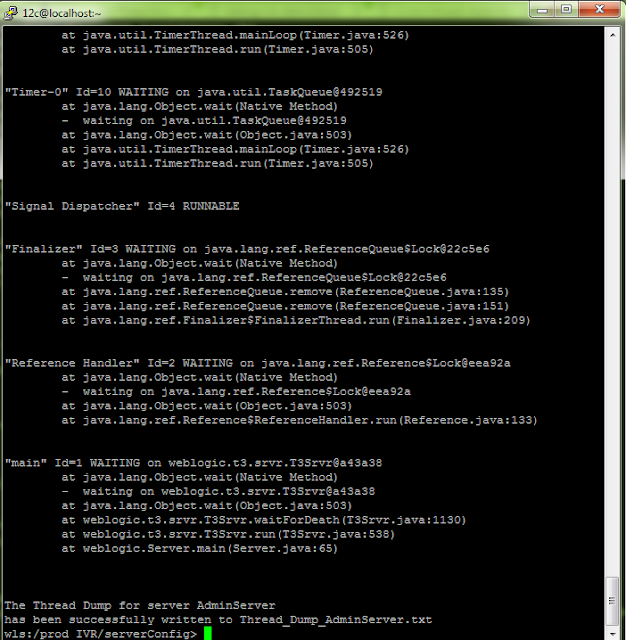
Output : Thread Dump for
AdminServer
 |
| Thread Dump for WebLogic AdminServer |


